Thursday, 2 July 2015

Referendum del 5 Luglio 2015

Sei d'accordo che debba essere accettata la bozza di accordo presentata dalla Commissione europea, la Banca centrale europea ed il Fondo Monetario Internazionale nel corso della riunione dell'Eurogruppo del 25 Giugno 2015, e che si compone di due documenti che costituiscono la loro unica proposta?
Il primo documento è intitolato "Le riforme per il completamento del programma in corso e di quelli successivi" ed il secondo "Analisi Preliminare della Sostenibilità del Debito".
I cittadini del paese che respingono la proposta delle tre istituzioni votino:
Non approvato / NO. 
I cittadini del paese che accettano la proposta delle tre istituzioni votino:
Approvato / SÌ

Δημοψήφισμα της 5ης Ιουλίου 2015

Πρέπει να γίνει αποδεκτό το σχέδιο συμφωνίας το οποίο κατέθεσαν η Ευρωπαϊκή Επιτροπή, η Ευρωπαϊκή Κεντρική Τράπεζα και το Διεθνές Νομισματικό Ταμείο στο Eurogroup της 25/06/2015 και αποτελείται από δύο μέρη τα οποία συγκροτούν την ενιαία πρότασή τους:
Το πρώτο έγγραφο τιτλοφορείται "Reforms for the completion of the Current Program and beyond" (Μεταρρυθμίσεις για την ολοκλήρωση του τρέχοντος προγράμματος και πέραν αυτού) και το δεύτερο "Preliminary Debt Sustainability Analysis" (προκαταρκτική ανάλυση βιωσιμότητας χρέους).
Οσοι από τους πολίτες της χώρας απορρίπτουν την πρόταση των τριών θεσμών ψηφίζουν:
Δεν εγκρίνεται/ΟΧΙ.
Οσοι από τους πολίτες της χώρας συμφωνούν με την πρόταση των τριών θεσμών ψηφίζουν:
Εγκρίνεται/ΝΑΙ

Tuesday, 30 June 2015

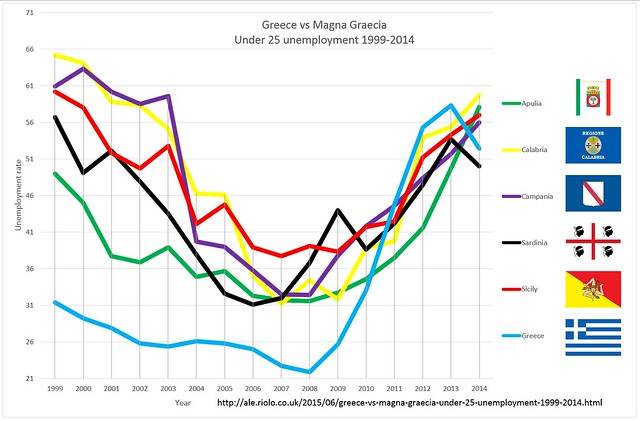
Greece vs Magna Graecia Under 25 unemployment 1999-2014

Greece had to do quite a catch up to reach the peaks of under 25 unemployment more usual in Magna Graecia. Luckily for the Greeks, in 2014 Campania, Sicily, Apulia and above all Calabria performed worst, truer to their sad tradition:

Greece vs Magna Graecia  Under 25 unemployment 1999-2014
The Eurostat data used in the diagram above can be found in the "Unemployment rates by sex, age and NUTS 2 regions (%)" dataset (lfst_r_lfu3rt).

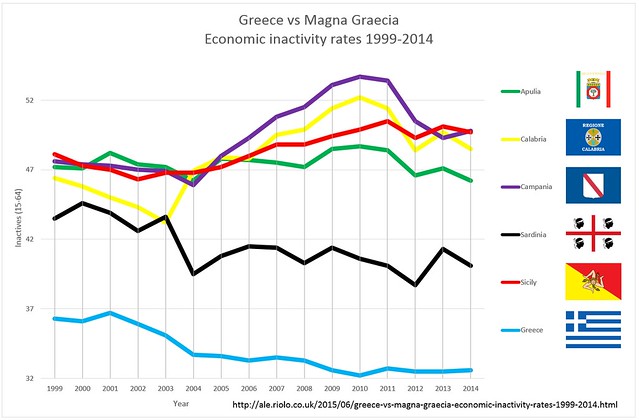
Greece vs Magna Graecia economic inactivity rates 1999-2014

Compared with the poorer third of Italy, Greece wouldn't appear to have such a big inactivity issue. Actually, the inactivity rate for the over 15 under 64 population appears to have slightly decreased in recent years:
Greece vs Magna Graecia Economic inactivity rates 1999-2014
The Eurostat data used in the diagram above can be found in the "Economic activity rates by sex, age and NUTS 2 regions (%)" dataset (lfst_r_lfp2actrt).

Monday, 29 June 2015

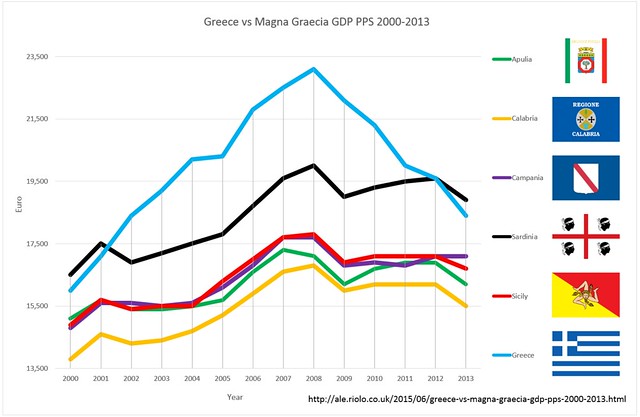
Greece vs Magna Graecia GDP PPS 2000-2013

If Greece will default on its public debt in the next weeks, and the Italian government will ask its Southern states to contribute with more cuts and new taxes to the attempt to cover the gargantuan €65 billion Euros black hole that default may potentially leave on its public accounts, this will be a textbook case of stealing from the poor after giving to the rich:

Greece vs Magna Graecia GDP PPS 2000 - 2013

Note: to compile the diagram above I had to combine the Eurostat "Regional gross domestic product by NUTS 2 regions", a series ending in 2011, with the more recent Istat "Prodotto interno lordo lato produzione", which was published after the introduction of ESA 2010. This involved some fancy transformation including applying the Eurostat purchasing power parities indices on the last couple of years myself. Chances there are that when in a couple of years Eurostat will provide us with an ESA 2010 updated "Regional gross domestic product by NUTS 2 regions" series, I'll have to review the diagram above, but we should not expect its core message to change.

P.S.: the title of the diagram and of the article is a simplification: Sardinia, like Abruzzi or Molise, was never considered part of Magna Graecia, but I did add one and left out the other two. Also, I didn't forget Basilicata, which instead was quite central to the concept of Magna Graecia, but the diagram was already pretty complex, so I decided to leave it out. Basilicata would have fared somewhere half way between Sardinia and Sicily.

Tuesday, 12 May 2015

Simplify and Shrink

The following scripts sets the non system databases to simple recovery model, and shrinks the related log files:

EXEC sp_MSforeachdb N'IF DatabasePropertyEx(''?'', ''Recovery'')=''FULL''
    and   DatabasePropertyEx(''?'', ''Status'')=''ONLINE''
    and ''?'' not in (''tempdb'') and ''?'' not in (''master'') and ''?'' not in (''model'') and ''?'' not in (''msdb'')
begin
  exec ('' print char(13) + char(10) + ''''Set recovery model to simple for '''' + ''''?'''';
 alter database [?] set recovery simple with NO_WAIT;'')
end'

EXEC sp_MSforeachdb 
N'IF DatabasePropertyEx(''?'', ''Status'')=''ONLINE''
    and ''?'' not in (''tempdb'') and ''?'' not in (''master'') and ''?'' not in (''model'') and ''?'' not in (''msdb'')
begin
 exec ('' use [?];
 declare @logFile varchar(128);
 select @logFile= mf.name from sys.master_files mf inner join sys.databases db on mf.database_id = db.database_id where type=1 and db.name = ''''?'''';
 print char(13) + char(10) + ''''Shrink ''''+ @logFile + '''' log file of ?'''';
 dbcc shrinkfile (@logFile , 0)
 '')
end'

Caveat: generally, don't use the above or similar scripts in Production, as long as you don't understand and accept the consequences. The Simple recovery model is usually fine in Test or Development environments, but again, it may not be appropriate in many scenarios.

Caveat: always read the message log.

Caveat: the second script assumption is that there is no more than 1 log file per database. If there are multiple log files per database, it would be more sensible to look at a solution which doesn't use sp_MSforeachdb.

Caveat: sp_MSforeachdb is undocumented, and AFAIK unsupported.

Caveat: the code above is provided "as is", without warranty of any kind, express or implied, including but not limited to the warranties of merchantability, fitness for a particular purpose and noninfringement. in no event shall the author be liable for any claim, damages or other liability, whether in an action of contract, tort or otherwise, arising from, out of or in connection with the software or the use or other dealings in the code above.

Friday, 9 January 2015

PIL pro capite Regionale Italiano vs British Regional per capita GDP

Per capita GDP comparison among british and italian regions (the percent column uses as index the GDP of Lombardia).

Regioni britanniche ed italiane a confronto per PIL pro capite (la colonna percentuale usa come indice il PIL della Lombardia).

Region | Regione GDP|PIL           %
UK Inner London 86,000 254%
UK North Eastern Scotland 42,700 126%
UK Berkshire, Buckinghamshire and Oxfordshire 38,400 113%
IT Provincia Autonoma di Bolzano/Bozen 37,700 111%
IT Lombardia 33,900 100%
IT Valle d'Aosta/Vallée d'Aoste 33,700 99%
IT Emilia-Romagna 32,100 95%
UK Cheshire 31,700 94%
IT Provincia Autonoma di Trento 31,200 92%
IT Veneto 30,200 89%
IT Lazio 29,900 88%
IT Friuli-Venezia Giulia 29,600 87%
UK Gloucestershire, Wiltshire and Bristol/Bath area 29,400 87%
UK Bedfordshire and Hertfordshire 28,700 85%
UK Surrey, East and West Sussex 28,700 85%
IT Piemonte 28,200 83%
IT Toscana 28,200 83%
UK Hampshire and Isle of Wight 27,400 81%
IT Liguria 27,200 80%
UK Eastern Scotland 26,200 77%
IT Marche 26,100 77%
UK East Anglia 25,200 74%
UK West Yorkshire 25,000 74%
UK Leicestershire, Rutland and Northamptonshire 24,800 73%
UK East Wales 24,500 72%
UK Greater Manchester 24,200 71%
UK Outer London 24,100 71%
UK North Yorkshire 24,000 71%
UK Herefordshire, Worcestershire and Warwickshire 24,000 71%
UK South Western Scotland 23,800 70%
IT Umbria 23,700 70%
UK West Midlands 23,300 69%
UK Essex 23,000 68%
UK Derbyshire and Nottinghamshire 22,700 67%
UK Kent 22,700 67%
UK Dorset and Somerset 22,500 66%
IT Abruzzo 22,400 66%
UK Cumbria 22,300 66%
UK Northumberland and Tyne and Wear 22,200 65%
UK Merseyside 21,600 64%
UK Devon 21,600 64%
UK East Yorkshire and Northern Lincolnshire 21,500 63%
UK Highlands and Islands 21,500 63%
UK Lancashire 21,000 62%
UK Northern Ireland 21,000 62%
UK Shropshire and Staffordshire 20,700 61%
IT Molise 20,100 59%
UK South Yorkshire 20,000 59%
UK Lincolnshire 19,800 58%
IT Sardegna 19,700 58%
UK Tees Valley and Durham 19,100 56%
IT Basilicata 18,300 54%
UK Cornwall and Isles of Scilly 17,300 51%
UK West Wales and The Valleys 17,200 51%
IT Puglia 17,100 50%
IT Sicilia 16,600 49%
IT Calabria 16,400 48%
IT Campania 16,000 47%

Eurostat data 2011 | Dati Eurostat 2011